PlanMaker
The GDPR-compliant alternative to Microsoft Excel
PlanMaker is the spreadsheet application in SoftMaker Office NX Universal:
fast, powerful, compatible and GDPR-compliant.


This is what the best alternative to Microsoft Excel looks like.
Compatible with Excel

Seamless exchange of documents
XLSX is the default file format of PlanMaker. You can open worksheets created with PlanMaker in Microsoft Excel, and vice versa.
With PlanMaker, the GDPR-compliant alternative to Microsoft Excel, you can also edit XLS files and create high-quality PDF and PDF/A files from your worksheets.
Calculate and analyze
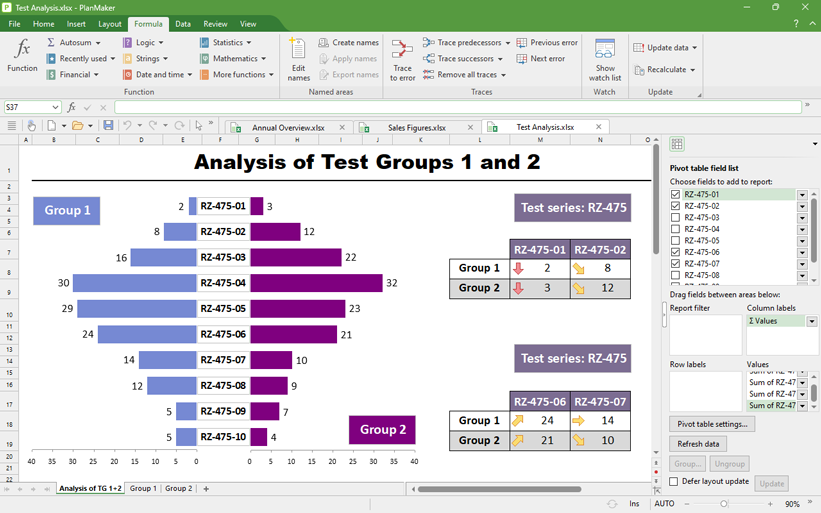
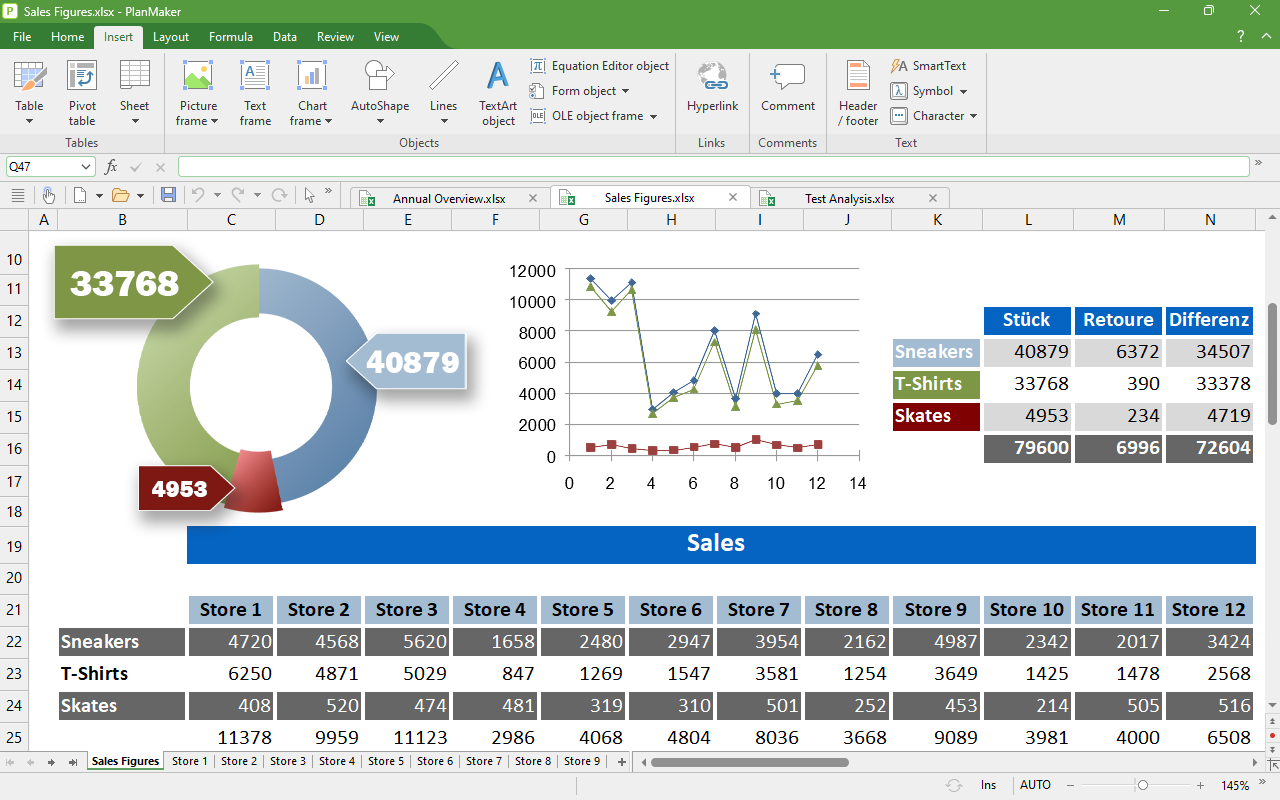
Find the right solutions, even in huge data sets
PlanMaker, the GDPR-compliant alternative to Microsoft Excel, allows up to one million rows per worksheet. To work with these huge data sets, you use pivot tables, data consolidation, scenarios, data grouping, AutoFilter and special filters. Thanks to multiple real-time calculations in the status bar, you are always kept abreast of the latest data changes.
If an error has crept into your worksheet, the syntax highlighting and formula auditing functions enable you to find it quickly.
Attractive worksheets
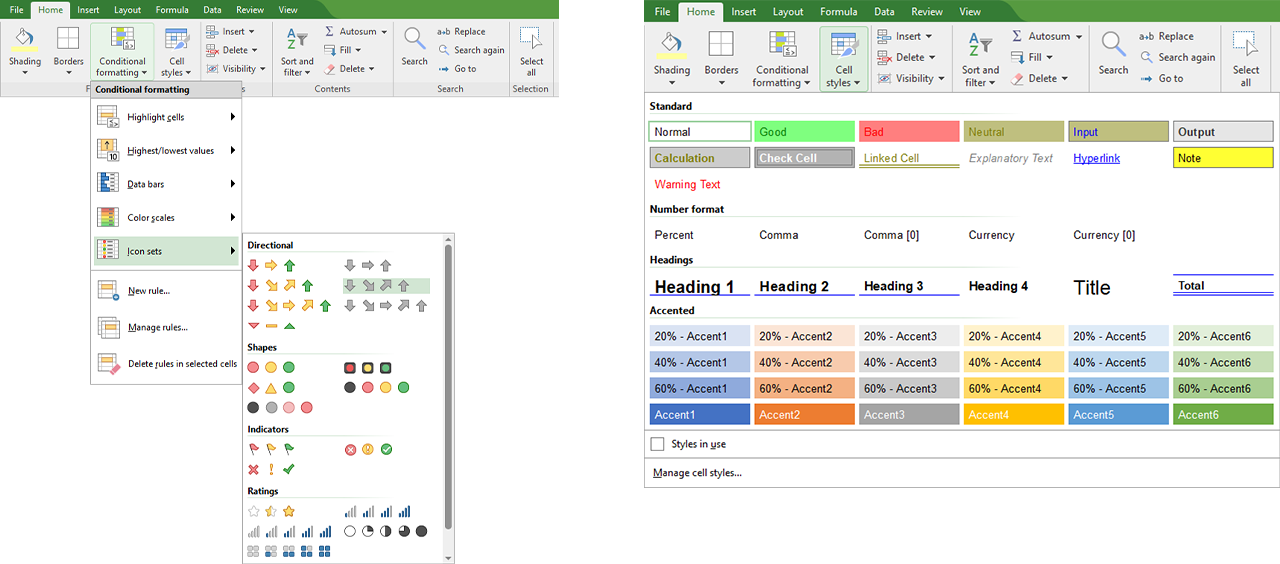
Design worksheets with PlanMaker
Create attractive worksheets using the cell-style catalog.
With conditional formatting, PlanMaker automatically finds the highest or lowest values in a data set and highlights them in color or with icons. In the same way, PlanMaker can assign a unique color from a gradient to each value in a range and visualize sizes with data bars.
Calculate on the go with the convenience of a desktop spreadsheet program

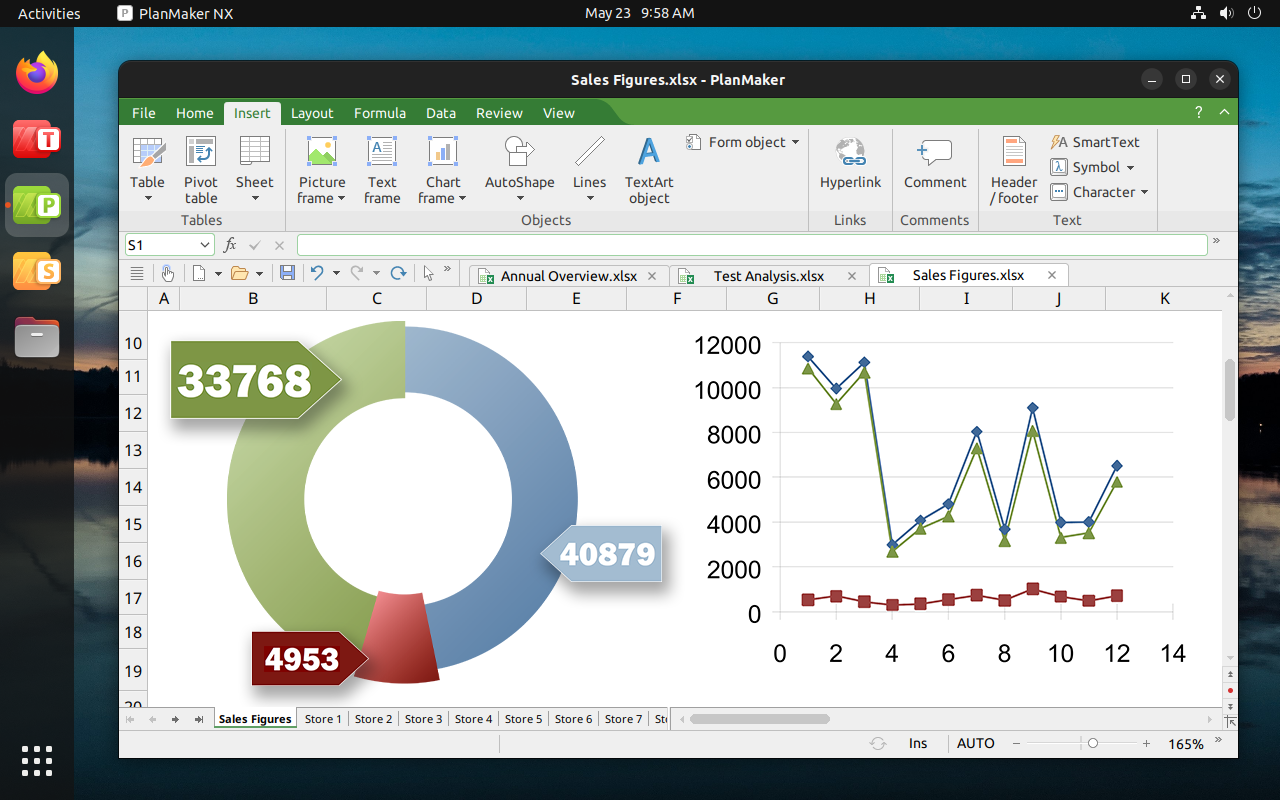
Work on your worksheets wherever and whenever you want.
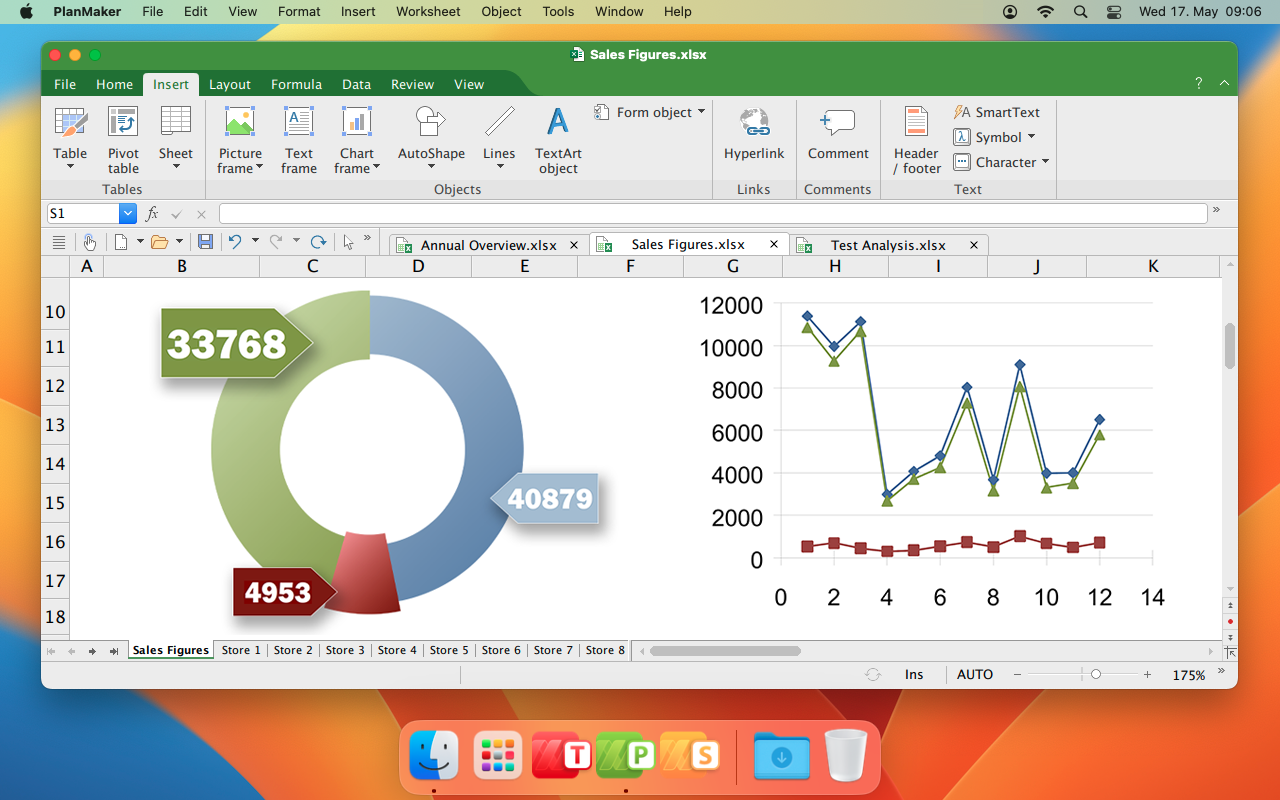
PlanMaker is not limited to Windows, Mac and Linux. As a user of SoftMaker Office NX Universal, you will also receive PlanMaker for your iPhone, iPad and Android device.
PlanMaker offers the full range of functions of a desktop spreadsheet program on iOS and Android.
Create sophisticated worksheets in no time and save them as compatible XLSX files.
Download now free of charge:


Present data convincingly
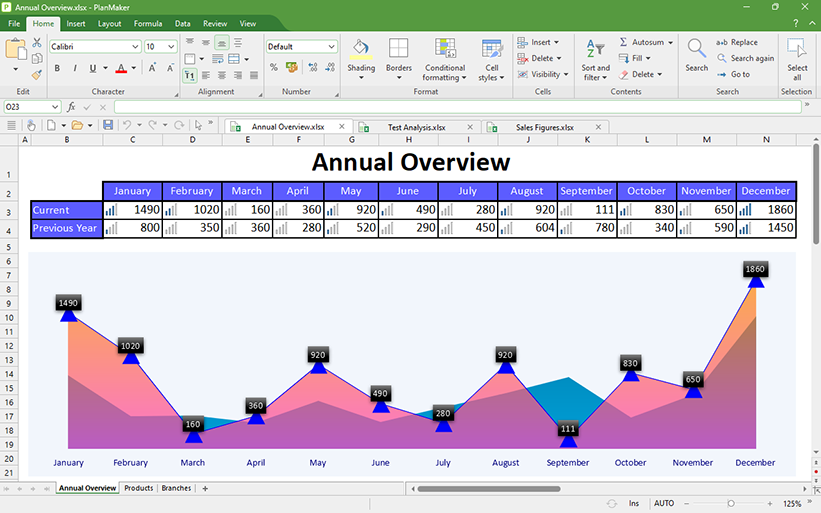
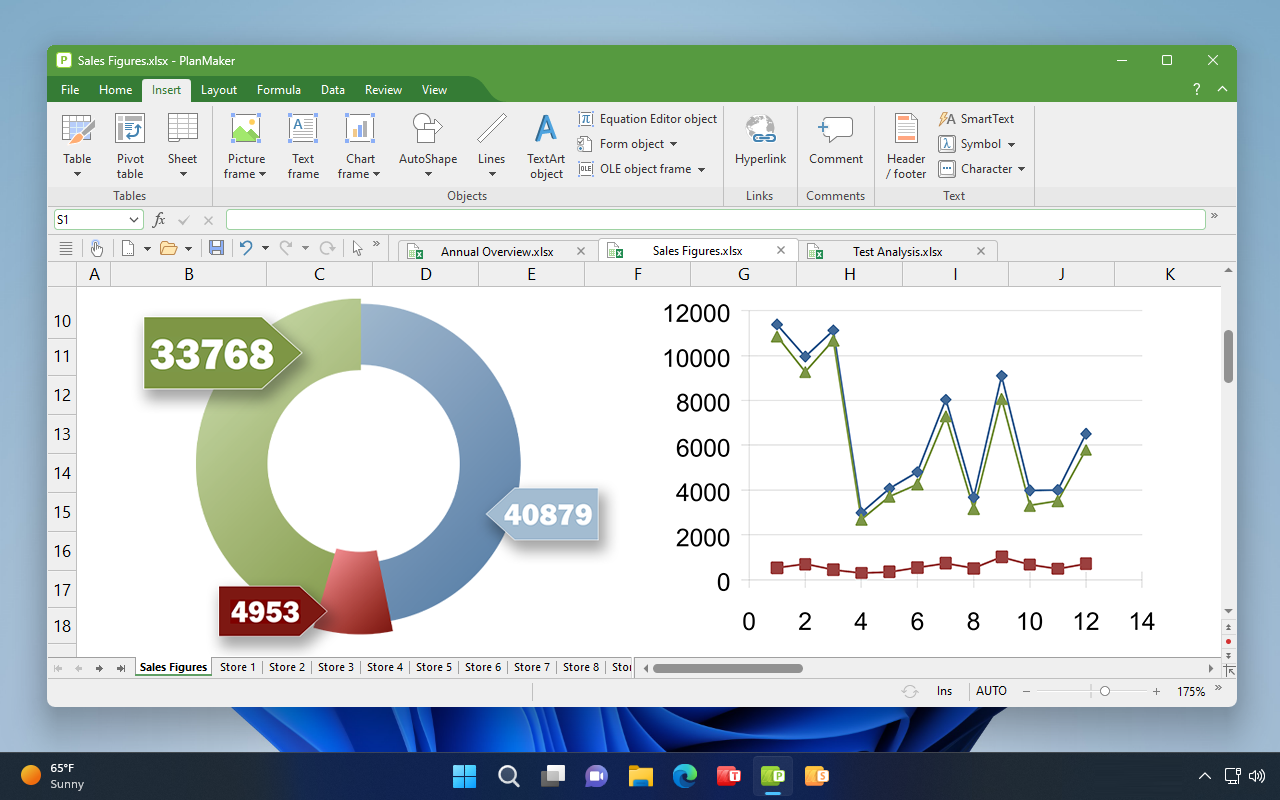
Transform numbers into informative charts
Create informative, presentation-quality charts from your data. Choose from 80 different chart types in 2D and 3D. Use a variety of effects, such as transparencies, shadows or light effects, to customize them to your liking.
With the page break preview, you can easily prepare your worksheets for printing.
PlanMaker
The GDPR-compliant alternative to Microsoft Excel
Get results quickly with PlanMaker. It solves even the most complex calculations and turns mere numbers into attractive worksheets and convincing charts.
Create better worksheets in less time thanks to PlanMaker, the GDPR-compliant alternative to Microsoft Excel.


Our best Office suite
SoftMaker Office NX Universal
- Duden Korrektor for German spelling and grammar check
- Duden style analysis for writing better German texts
- LanguageTool for grammar and style checking in more than 30 languages
- Automatic translations with DeepL
- Writing, rewriting and summarizing with ChatGPT’s Artificial Intelligence
- Font management with a professional font library included
- Works on five operating systems: Windows, macOS, Linux, iOS and Android.
- Strictly in accordance with European data protection: GDPR-compliant alternative to Microsoft Office (Word, Excel, PowerPoint) for business and personal use
- Subscription for 1 or 12 months
- Always up-to-date with the latest features and functions
- Licensed for 5 computers of the same household, or 1 computer of a company or organization
- 5 computers – US$199.50
- 10 computers – US$399
- 25 computers – US$997.50
- 50 computers – US$1,995
- 100 computers – US$3,590
This email address is being protected from spambots. You need JavaScript enabled to view it.
SoftMaker Office for Android
Comparison with other office suites
|
|
SoftMaker Office |
Microsoft 365 |
Google Docs |
WPS Office |
OfficeSuite Pro |
Polaris Office Premium |
Docs To Go |
|---|---|---|---|---|---|---|---|
| Program name | TextMaker | Microsoft Word | Google Docs | WPS Office | OfficeSuite | Polaris Office Premium | Docs To Go |
| Version | NX | 1.0.1 (16.0.13328.20160) | 1.20.422.02.40 | 12.9.1.66965b2899d-en00001 | 10.22 | 9.0.9 | 4.0 |
| Price | free of charge | €7.00 per month | free of charge | € 5.49 per month € 38.99 per year |
€ 3.89 per month € 28.99 per year |
€ 6.37 per month € 42.99 per year |
€16.99 |
| Manufacturer | SoftMaker | Microsoft | Kingsoft | MobiSystems | Infraware | DataViz | |
| Related desktop version | Windows, Mac, Linux | Windows, Mac | Windows, Linux | Windows | Windows, Mac | Windows | |
Files and compatibility |
|||||||
| Read | write Microsoft Word .doc files | | | | | | | | | | | | | | |
| Read | write Microsoft Word .docx files | | | | | | | | | | | | | | |
| Read and write password-protected .doc and .docx files | (password-protected .docx files cannot be edited) |
||||||
| Activate/deactivate password protection for documents | |||||||
| Maintains the original style and layout of your Word documents | |||||||
| Displays the original formatting and content of your Word documents | |||||||
| Save a file in another format (e.g. a .docx file as .doc) | |||||||
| Open and save HTML files | |||||||
| Other supported file formats | RTF, OpenDocument Text (ODT), LibreOffice, OpenOffice, TextMaker (all versions), Pocket Word, plain-text files | Plain-text files | RTF, plain-text files, ODT (only import) | ||||
| Lets you open multiple documents at the same time in document tabs | |||||||
| Export documents to PDF format from within the program | * | ||||||
| Customizable PDF export settings (such as password protection, font embedding, tags, etc.) | * | ||||||
| Export documents to EPUB format for use as e-books | * | ||||||
| Print documents using the Android print system | * | ||||||
| Mail merge | |||||||
| Address database | |||||||
| Envelope wizard | |||||||
| Direct access from the program to files in Google Drive | Dropbox | | | | | | | | | | | | | | |
| Display | edit document properties (author, subject, keywords, etc.) | | | | | | | | | | | | | | |
| Use any TrueType, OpenType and PostScript fonts in your documents | |||||||
Edit and format documents |
|||||||
| Bullets and numbered lists | |||||||
| Hyperlinks | |||||||
| Insert fields (date, page number, author, etc.) | |||||||
| Drop caps | |||||||
| Automatic calculations in text and tables | |||||||
| Insert tables | Merge and split cells | | | | | | | | | | | | | | |
| Table formatting: Borders | Grid | Color fills | Shading | AutoFormat | | | | | | | | | | | | | | | | | | | | | | | | | | | | | | | | | | | |
| True master pages | Edit headers and footers | Insert new headers and footers | | | | | | | | | | | | | | | | | | | | | |
| Insert breaks: Page | Line | Column | Section | Chapter | | | | | | | | | | | | | | | | | | | | | | | | | | | | | | | | | | |
| Bookmarks: Insert | Go to | | | | | | | | | | | | | | |
| Insert symbols from a character table | |||||||
| SmartText ("asap" appears as "as soon as possible", etc.) | |||||||
| Ruler for setting tabs and margins: horizontal | vertical | | | | | | | | | | | | | | |
| Statistics: Count words, characters, paragraphs, lines, tables, pictures, etc. | |||||||
| Paragraph styles: Apply | Edit | | | | | | | | | | | | | | |
| Character styles: Apply | Edit | | | | | | | | | | | | | | |
| Stylesheet manager for managing and copying styles between documents | |||||||
Language tools |
|||||||
| Check the spelling as you type | |||||||
| Dictionaries for many languages included | |||||||
| Automatic hyphenation | |||||||
Images, charts and drawings |
|||||||
| Insert images from the gallery | from files | | | | | | | | | | | | | | |
| Comprehensive image editing: cropping, brightness, contrast, saturation, transparency, shading, mirror effects, etc. | |||||||
| Insert charts | |||||||
| Comprehensive formatting choices for charts: scaling, titles, legends, colors, gradients, bevels, lighting effects, etc. | |||||||
| Insert drawings | AutoShapes | | | | | | | | | | | | | | |
| Comprehensive formatting choices for drawings and shapes: colors, lines, patterns, transparency, gradients, shading, etc. | |||||||
| Insert text boxes | |||||||
| Comprehensive formatting choices for text boxes: size, position, borders, fill, shading, lighting and mirror effects, etc. | |||||||
| Adjust text wrap around objects | |||||||
| TextArt module for font effects | |||||||
Complex documents |
|||||||
| Comments: Display them as in Word for Windows | Edit | Insert | Format | | | | | | | | | | | | | | | | | | | | | | | | | | | | |
| Track changes: Display changes | Accept/reject changes | Insert new changes | | * | * | | | | | | | | | | | | | | | | | | |
| Footnotes and endnotes: Edit | Format | Insert | | | | | | | | | | | | | | | | | | | | | |
| Captions | Tables of figures | | | | | | | | | | | | | | |
| Tables of contents | Indexes | Bibliographies | | | | | | | | | | | | | | | | | | | | | |
| Cross references | |||||||
| Built-in outliner for structuring documents | |||||||
| Create forms (input fields, checkboxes, dropdown lists, calculations, etc.) | |||||||
| Form mode for filling out forms | |||||||
| Sidebar for quick navigation in documents and text formatting | |||||||
* These features are available to customers through an inexpensive Google Play subscription or a SoftMaker Office NX license.
|
|
SoftMaker Office |
Microsoft 365 |
Google Docs |
WPS Office |
OfficeSuite Pro |
Polaris Office Premium |
Docs To Go |
|---|---|---|---|---|---|---|---|
| Program name | PlanMaker | Microsoft Excel | Google Sheets | WPS Office | OfficeSuite | Polaris Office Premium | Docs To Go |
| Version | NX | 1.0.1 (16.0.13328.20160) | 1.20.422.02.40 | 12.9.1.66965b2899d-en00001 | 10.22 | 9.0.9 | 4.0 |
| Price | free of charge | € 7.00 per month | free of charge | € 5.49 per month € 38.99 per year |
€ 3.89 per month € 28.99 per year |
€ 6.37 per month € 42.99 per year |
€ 16.99 |
| Manufacturer | SoftMaker | Microsoft | Kingsoft | MobiSystems | Infraware | DataViz | |
| Related desktop version | Windows, Mac, Linux | Windows, Mac | Windows, Linux | Windows | Windows, Mac | Windows | |
Files and compatibility |
|||||||
| Read | write Microsoft Excel .xls files | | | | | | | | | | | | | | |
| Read | write Microsoft Excel .xlsx files | | | | | | | | | | | | | | |
| Read and write password-protected .xls and .xlsx files | |||||||
| Activate/deactivate password protection for worksheets | |||||||
| Maintains the original style and layout of your Excel worksheets | |||||||
| Displays the original formatting and content of your Excel worksheets | |||||||
| Save a file in another format (e.g. an .xlsx file as .xls) | |||||||
| Save worksheets in HTML format | |||||||
| Other supported file formats | SYLK, RTF, dBASE, DIF, PlanMaker (all versions), OpenDocument Calc (only import) | (cannot save even to .xls format) | CSV, ET | CSV, ODS (only import) | |||
| Lets you open multiple documents at the same time in document tabs | |||||||
| Export worksheets to PDF format from within the program | * | ||||||
| Customizable PDF export settings (such as password protection, font embedding, tags ...) | * | ||||||
| Print documents using the Android print system | * | ||||||
| Direct access from the program to files in Google Drive | Dropbox | | | | | | | | | | | | | | |
| Display | edit document properties (author, subject, keywords ...) | | | | | | | | | | | | | | |
| Use any TrueType, OpenType and PostScript font in your documents | |||||||
Comprehensive calculation capabilities |
|||||||
| Number of rows per sheet | 1,048,576 | 1,048,576 | 1,000 to 65,536 | 65,536 | 65,536 | 1,048,576 | 1,048,576 |
| Number of columns per sheet | 16,384 | 16,384 | 26 to 256 | 256 | 256 | 16,384 | 16,384 |
| Number of mathematical functions | 430 | 425 | 333 | 310 | 227 | 236 | 113 |
| Complex numbers | |||||||
| Array functions: Recalc | Create | Edit | | | | | | | | | | | | | | | | | | | | | |
| Set and edit user-defined numeric formats | |||||||
| External references (calculations that access data in other files) | |||||||
Editing and formatting worksheets |
|||||||
| Customized cell formatting: Borders, fills, colors and shading | Alternating cell shading | | | | | | | | | | | | | | |
| AutoFormat: Attractive worksheets at the press of a button | |||||||
| Define and apply user-created cell styles and character styles | |||||||
| Conditional formatting | Format brush | | | | | | | | | | | | | | |
| Direct editing in the cell | |||||||
| Freeze rows and columns | |||||||
| Activate/deactivate workbook and sheet protection with password | |||||||
| Syntax highlighting | Display formulas instead of results in the cells | | | | | | | | | | | | | | |
| Formula auditing (a "detective" for troubleshooting worksheets) | |||||||
| Data validation (input check) | |||||||
| Sort data | Customized sorting | Number of sorting levels | | | | | | | | | | | | | | |
| Transpose data | |||||||
| Insert form objects (check boxes, lists, buttons ...) | |||||||
| Insert hyperlinks | Headers and footers | Page breaks | | | | | | | | | | | | | | | | | | | | | |
| Rotated text | |||||||
| SmartText ("asap" appears as "as soon as possible", etc.) | |||||||
| Insert symbols from a character table | |||||||
| Cell comments: Display them like in Excel for Windows | Edit | Insert | Format | | | | | | | | | | | | | | | | | | | | | | | | | | | | |
| Check the spelling as you type | |||||||
| Spelling dictionaries for many languages included | |||||||
Analyzing data |
|||||||
| Pivot tables: Display | Edit | Create | | | | | | | | | | | | | | | | | | | | | |
| Scenarios ("what if?" analysis) | |||||||
| Goal seeker | |||||||
| Data consolidation | |||||||
| Data grouping (outliner) | |||||||
| AutoFilter | Special filter | | | | | | | | | | | | | | |
Charts, images and drawings |
|||||||
| Displays all Excel chart types true to the original | Displays 3D charts | | | | | | | | | | | | | | | | | | | | |
| Create charts | Number of chart types | | 81 | | 41 | | 25 (function not always available) |
| 29 | | 16 | | 20 | | |
| Comprehensive formatting choices for charts: scaling, titles, legends, colors, gradients, bevels ... | |||||||
| Insert images from the gallery | from files | | | | | | | | | | | | | | |
| Comprehensive image editing: cropping, brightness, contrast, saturation, transparency, shadow, mirror effects ... | |||||||
| Insert drawings | AutoShapes | | | | | | | | | | | | | | |
| Comprehensive formatting choices for drawings and shapes: colors, lines, transparency, gradients, shading, patterns ... | |||||||
| Insert text boxes | |||||||
| Comprehensive formatting choices for text boxes: size, position, borders, fill, shading, lighting, mirror effects ... | |||||||
| TextArt module for type effects | |||||||
* These features are available to customers through an inexpensive Google Play subscription or a SoftMaker Office NX license.
|
|
SoftMaker Office |
Microsoft 365 |
Google Docs |
WPS Office |
OfficeSuite Pro |
Polaris Office Premium |
Docs To Go |
|---|---|---|---|---|---|---|---|
| Program name | Presentations | Microsoft PowerPoint | Google Slides | WPS Office | OfficeSuite | Polaris Office Premium | Docs To Go |
| Version | NX | 1.0.1 (16.0.13328.20160) | 1.20.422.02.40 | 12.9.1.66965b2899d-en00001 | 10.22 | 9.0.9 | 4.0 |
| Price | free of charge | € 7.00 per month | free of charge | € 5.49 per month € 38.99 per year |
€ 3.89 per month € 28.99 per year |
€ 6.37 per month € 42.99 per year |
€ 16.99 |
| Manufacturer | SoftMaker | Microsoft | Kingsoft | MobiSystems | Infraware | DataViz | |
| Related desktop version | Windows, Mac, Linux | Windows, Mac | Windows, Linux | Windows | Windows, Mac | Windows | |
Files and compatibility |
|||||||
| Read | write Microsoft PowerPoint .ppt files | | | | | | | | | | | | | | |
| Read | write Microsoft PowerPoint .pptx files | | | | | | | | | | | | | | |
| Read and write password-protected .ppt and .pptx files | |||||||
| Activate/deactivate password protection for presentations | |||||||
| Maintains the original style and layout of your PowerPoint presentations | |||||||
| Displays the original formatting and content of your PowerPoint presentations | |||||||
| Save a file in another format (e.g. .pptx file as .ppt) | |||||||
| Other supported file formats | |||||||
| Lets you open multiple documents at the same time in document tabs | |||||||
| Export presentations to HTML format | |||||||
| Export sets of slides as image files | |||||||
| Export presentations to PDF format from within the program | * | ||||||
| Customizable PDF export settings (such as password protection, font embedding, tags ...) | * | ||||||
| Print documents using the Android print system | * | ||||||
| Direct access from the program to files in Google Drive | Dropbox | | | | | | | | | | | | | | |
| Display | edit document properties (author, subject, keywords ...) | | | | | | | | | | | | | | |
| Use any TrueType, OpenType and PostScript font in your documents | |||||||
Editing and formatting documents |
|||||||
| Slide transitions: Play | Insert | | | | | | | | | | | | | | |
| Animations: Play | Insert | | | | | | | | | | | | | | |
| Animation schemes: Play | Insert | | | | | | | | | | | | | | |
| Sound and music: Play | Insert | | | | | | | | | | | | | | |
| Character formatting: typeface, font style, size, color ... | Paragraph formatting: alignment, margins, spacing ... | | | | | | | | | | | | | | |
| Numbered lists | Lists with bullets | Lists with numerous integrated graphic bullets | | | | | | | | | | | | | | | | | | | | | |
| Insert tables | Custom formatting: merge/split cells, borders, grid, color fill, scale ... | | | | | | | | | | | | | | |
| Insert slides from external presentations | from an outline | | | | | | | | | | | | | | |
| Create actions (e.g. on mouse click: mute sound, URL, send e-mail ...) | |||||||
| Universal placeholders (can be filled with text, images, tables ...) | |||||||
| True master pages | Format and edit headers and footers | Insert headers/footers | | | | | | | | | | | | | | | | | | | | | | | | |
| Comments: Display them like in PowerPoint for Windows | Edit | Insert | Format | | | | | | | | | | | | | | | | | | | | | | | | | | | | | | |
| Check the spelling as you type | |||||||
| Spelling dictionaries for many languages included | |||||||
Images, charts and drawings |
|||||||
| Insert images from the gallery | from files | | | | | | | | | | | | | | |
| Comprehensive image editing: cropping, brightness, contrast, saturation, transparency, shading, mirror effects ... | |||||||
| Insert charts | |||||||
| Comprehensive formatting choices for charts: scaling, titles, legends, colors, gradients, bevels, lighting sources ... | |||||||
| Insert drawings | AutoShapes | | | | | | | | | | | | | | |
| Comprehensive formatting choices for drawings and shapes: colors, lines, transparency, gradients, shading, patterns ... | |||||||
| Insert text boxes | |||||||
| Comprehensive formatting choices for text boxes: size, position, borders, fill, shading, lighting and mirror effects ... | |||||||
| TextArt module for type effects | |||||||
Designing and managing slides |
|||||||
| Numerous design templates included | Slide layouts | | | | | | | | | | | | | | |
| Create custom color schemes | Switch color schemes at the press of a button | | | | | | | | | | | | | | |
| Integrated full-screen slide sorter | |||||||
| Outliner (outline view) | |||||||
| Create summary slides | |||||||
| Create photo albums | |||||||
Running slide shows |
|||||||
| Playback of: Slide transitions | Animations | Animation schemes | Sound and music | | | | | | | | | | | | | | | | | | | | | | | | | | | | |
| User-guided slide show (slides progress with finger taps) | |||||||
| Automatic slide show (uses the timings stored in the presentation) | |||||||
| Unattended slide shows (kiosk mode) | |||||||
| Use notes in presentations | |||||||
| Interact in the presentation with pen | with highlighter | | | | | | | | | | | | | | |
* These features are available to customers through an inexpensive Google Play subscription or a SoftMaker Office NX license.